
The new online demo of Manta Flow is ready for you in our Demo Center. Check it out!
Manta Flow analyzes complex
data lineage based on actual code, and we are now giving you the option to try it out for yourself, even before you request a trial version. You can now run our sample scripts, upload your own files or even directly paste your code. Our simple guide will help you get through it:
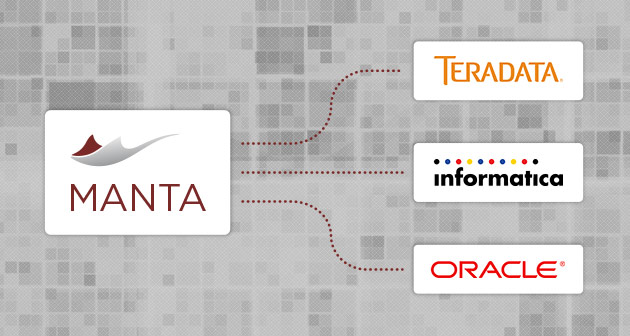
- Step 1: Choose your technology. Teradata or Oracle? Informatica PowerCenter transformations are also available, but you can use our samples only.
- Step 2: Select input type. Do you want to run our scripts or your own? Take your pick.
- Step 3: Upload a script. If you want to use your own file, please select the right encoding, otherwise visualization might fail. Please note, that file size is limited to 25 kB. We’ve also included some additional options, You can get extra info about them by hovering over the question mark buttons.
- Step 4: Click on the “Visualize” button. Visualizing may take a few seconds. Your data lineage visualization will open in a new tab/window. If your browser blocks it, you can still manually open it on the next page.

The main screen of Manta Flow is pretty self-explanatory, so we are not going to bore you with pages of unnecessary text. But here are a couple of features you might want to check out:
- Double-click to reveal the truth. A source file preview is also available when you double-click on any code element.
- Right-click saves the day. Left-clicking gets you the flow; right-clicking gets you the context menu. You can also unroll the details of chosen element under the search bar in the top-left corner.
- “Heating system”. When you click on any node or table, it turns yellow. The corresponding nodes before it are highlighted in blue and those after it are red. You know, as water flows through the boiler.
- Set sail for the right course. Navigational buttons are in the bottom-left corner. You can zoom in or out and use the undo/redo function.
- Find what you are looking for. Search through the entire lineage for a specific node or table. In real-time, of course.
- Take something with you. A button under the search bar allows you to export your visualization as a simple CSV or fancy PNG picture.
Our Manta Flow online demo is here for you 24/7, 365 days a year. You can try it as many times as you want. And when you are ready to move our relationship to the next level, just get in touch via email or use the form on the right. Also make sure you follow us on Twitter, it’s pretty cool there.